Statistics
For each job, a so-called “BV statistic” or “runtime statistic” is logged. The statistics are included in the Viper.NET shell as User-Tabs.
BV Statistics
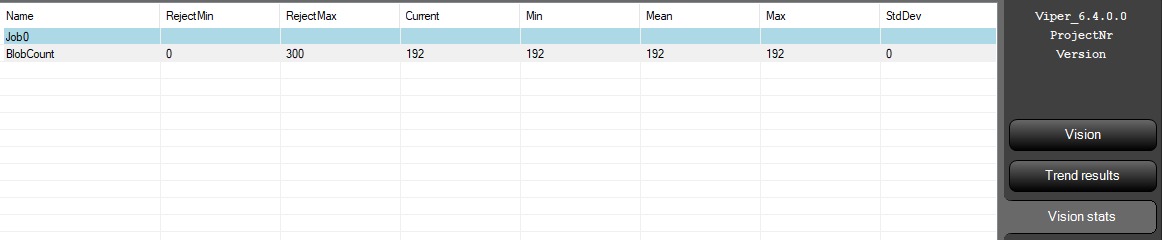
All results from the CogDataAnalysis tools and the statistics are displayed here in tabular form for each job. The values are taken 1:1 from the tools.
“Reset” deletes the statistics of the CogDataAnalysisTools of the active ToolGroupItems.
Runtime statistics
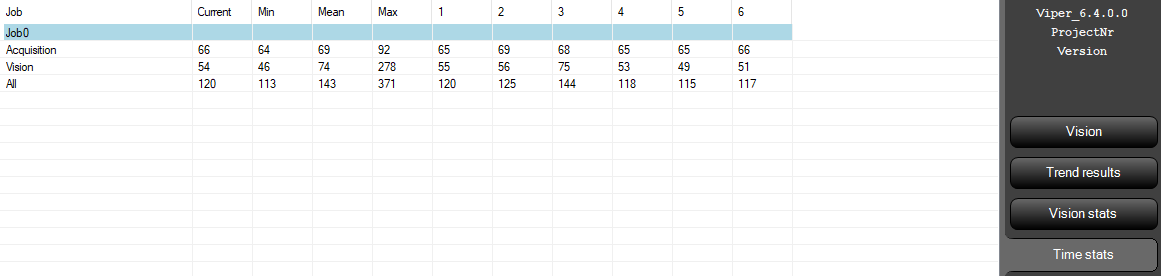
For each job, three separate run times are shown here: Acquisition (image acquisition), Vision (image-processing computation) and All (total). For each, the current run time, that of the 6 most recent runs, the moving average of the last 100 runs and the minimum/maximum (since the last reset) are displayed.
Trend results
As a further analysis tool, it is possible to display trend graphics. These show defined values and their progression graphically (e.g. the height of a component).
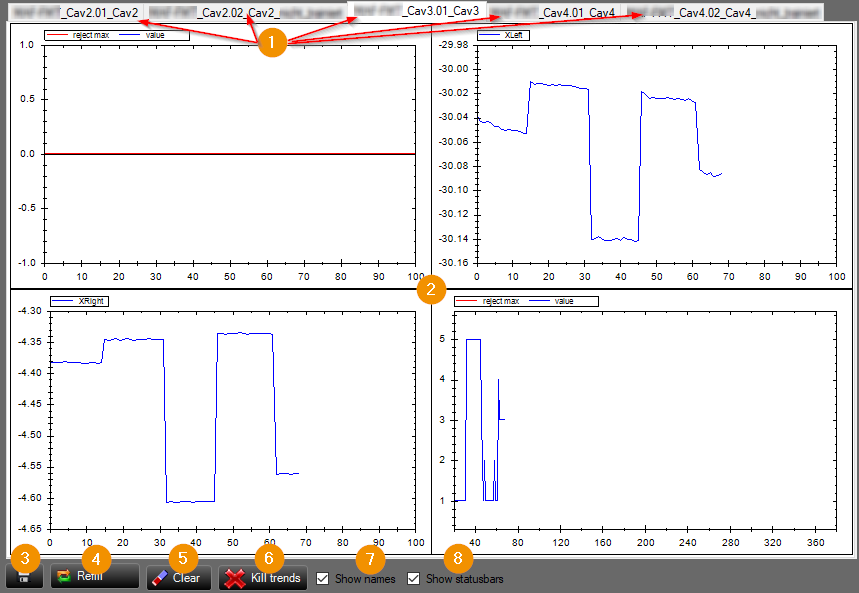
Tabs always contain the entire graphics of a job or station.
Display of the result graphic
Save current values
Reload result graphic
Delete result graphic
Deletes all stored trends
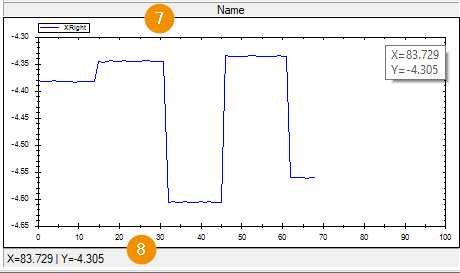
Displaying the name
Displaying the status bars
The recording of the trends are configured in the job editor in the tab history.
Trends can also be displayed as Subdisplay in ToolGroup-Item Views.